January 19th, 2026
Ultimate Guide to Analytics for Product Validation
Use analytics to validate product ideas by tracking conversion, engagement, retention, and the right metrics and tools to confirm real user demand.
Warren Day
Most products fail because they solve problems nobody cares about. To avoid this, product validation ensures your idea resonates with users before investing heavily. Analytics plays a key role by replacing guesswork with data, helping you focus on what users need and value.
Key Takeaways:
- Why validation matters: It reduces risk by testing ideas with real user feedback, increasing the likelihood of product-market fit.
- How analytics helps: Tracks user behavior, highlights friction points, and identifies features users engage with most.
- Metrics to track: Conversion rates, bounce rates, time on page, stickiness (DAU/MAU ratio), and Quick Ratio.
- Tools to use: Google Analytics 4 (GA4), Mixpanel, Hotjar, and LaunchSignal for streamlined validation.
By leveraging analytics, you can confidently refine your product, prioritize features that matter, and avoid building solutions no one uses.
Key Metrics for Product Validation
Key Product Validation Metrics and Benchmarks for Startups
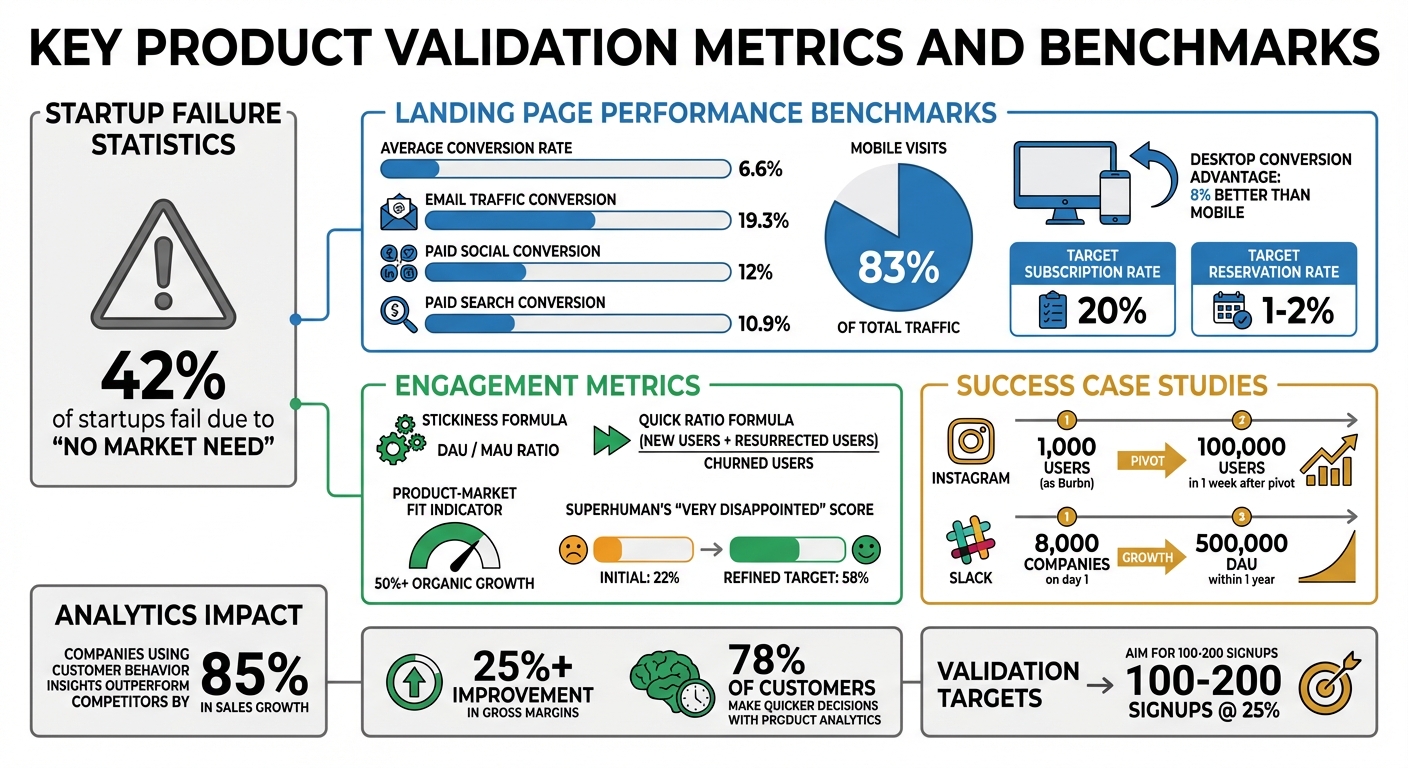
Tracking the right metrics can be the difference between a successful product launch and a complete flop. Did you know 42% of startups fail because there’s "no market need" for their product? Often, this happens because they focus on the wrong numbers - like page views or social media likes - instead of metrics that show genuine user interest and intent.
To make smarter decisions, it’s important to separate macro conversions (final actions like purchases) from micro-conversions (early indicators of interest). Take Instagram, for example. It started as "Burbn", an app overloaded with features, yet it only had 1,000 users. When the team analyzed user behavior, they noticed people were only using photo-sharing and filters. By cutting everything else, Instagram skyrocketed to 100,000 users in just one week.
Let’s dive into the metrics that can help you validate your product.
Landing Page Performance Metrics
Your landing page is a window into how much people actually want your product. The conversion rate is the most telling metric here. While the average across industries is 6.6%, email traffic converts much higher at 19.3%, compared to paid social (12%) and paid search (10.9%). If your conversion rate falls short, it’s time to refine your value proposition.
Other key metrics include bounce rate and time on page, which reveal whether visitors stick around long enough to engage with your offer. A high bounce rate often means your ads and landing page content don’t align. You should also track scroll depth to see if users are reaching your core message. And don’t forget to segment by device type - 83% of visits happen on mobile, but desktops still convert 8% better. Ignoring these differences could hide critical friction points.
To measure intent more directly, monitor subscription rates (aim for 20%) and reservation rates (aim for 1%-2%). Superhuman’s founder Rahul Vohra took a unique approach during the company’s early days. He asked users how disappointed they’d be if the service disappeared. Initially, only 22% said "very disappointed", but by focusing on a core group of busy executives who scored 58%, he was able to refine the product before a full launch.
"Product-market fit means being in a good market with a product that can satisfy that market." - Marc Andreessen, Co-founder, Andreessen Horowitz
Metrics from your landing page are just the start. To truly validate your product, you need to look at how users interact with it over time.
User Engagement Signals
Engagement metrics help you understand if your product is valuable enough for users to keep coming back. For example, email sign-ups show initial interest, while questionnaire responses and feature interaction rates reveal what users find most compelling. A key metric here is stickiness (the DAU/MAU ratio), which measures how often users return - a strong indicator of long-term product-market fit.
Watch out for form abandonment, as it often highlights areas of friction. Tools like heatmaps can also pinpoint problems, such as "rage clicks" (users repeatedly clicking a frustrating element) or "cold spots" on your call-to-action buttons. Another valuable metric is the Quick Ratio, calculated as (New Users + Resurrected Users) / Churned Users. This tells you whether you’re building a loyal user base or just replacing lost users.
Slack is a great example of using engagement signals to pivot effectively. Originally an internal tool for "Glitch", the team noticed higher engagement within Slack itself. They shifted focus, and the result was explosive growth - 8,000 companies signed up on the first day, and Slack hit 500,000 daily active users within a year. Such organic growth - over 50% - is a clear sign you’ve hit product-market fit.
"The most important thing is seeing user activity grow within a product organically." - Zach Berger, Technology Investor, Bain Capital
sbb-itb-9a9c51d
Tools for Analytics and Validation
You don't need to break the bank to find the right tools for analytics and product validation. Google Analytics 4 (GA4) is a top choice for tracking traffic and basic user behavior - and it’s free. If you need something more advanced, Mixpanel offers a free plan that allows tracking up to 1,000,000 events per month.
"Good analytics don't drown you in charts. They nudge you toward better judgment, faster." - OpenHunts
General Analytics Tools Overview
Web analytics tools like GA4 and Plausible help answer questions like, "Where are visitors coming from?" These tools shine when it comes to understanding traffic sources and analyzing page performance. On the other hand, product analytics platforms such as Mixpanel and Amplitude go deeper, tracking user actions within your app and measuring retention. For insights into user behavior, tools like Hotjar and FullStory provide session replays and heatmaps, showing exactly where users encounter friction.
When it comes to pricing, there’s a wide range. GA4 is free, but enterprise-level platforms can cost anywhere from $10,000 to $122,000 annually. For mid-range budgets, LogRocket starts at $69 per month, while privacy-focused options like Plausible are more affordable, costing between $9 and $19 per month. Instead of tracking everything from the start, focus on monitoring 5–10 key events that align directly with your validation goals.
While these tools provide general insights, some platforms are tailored specifically for the validation phase, making the process more efficient.
Using LaunchSignal for Fast Validation
LaunchSignal simplifies the validation process with a laser focus on early-stage product testing. It allows you to create validation-specific landing pages in just one day and track high-intent actions like email signups, completed questionnaires, and even simulated checkouts.
Its built-in analytics dashboard makes it easy to compare multiple product ideas side by side. This helps you quickly determine which concept resonates most with your target audience. This approach is grounded in data - and for good reason. Companies that use customer behavior insights outperform their competitors by 85% in sales growth and over 25% in gross margins.
To validate a product idea effectively, aim to gather 100–200 signups at a 25% conversion rate. LaunchSignal’s dashboard is designed to track these benchmarks seamlessly, eliminating the need to juggle multiple tools.
Step-by-Step Guide to Data-Driven Validation
Setting Up Your Analytics Dashboard
To get started, set up a Google Analytics 4 property by entering your business details. As part of the process, create a data stream for your platform - whether it’s Web, iOS, or Android - and add the gtag.js snippet to your site's <head> section. If you're on platforms like WordPress or Shopify, use the Measurement ID (which starts with "G-") instead of the Stream ID to ensure accurate data collection.
Next, establish a Tracking Plan to map out key user actions, such as user_signup, video_played, or subscription_upgraded, aligning them with your funnel stages. Using an "Object-Action" naming format helps maintain clarity and consistency for your team.
Make sure to extend the Data Retention period from the default 2 months to 14 months by navigating to Admin > Data Settings. This step is crucial for preserving historical data that can reveal long-term trends. During the data stream setup, enable "Enhanced Measurement" to automatically track interactions like scrolls, outbound clicks, and site searches. Once your tracking code is deployed, verify that data is flowing correctly by checking the "Realtime" report in a separate browser window.
With your analytics dashboard fully configured, you're ready to dive into user behavior analysis.
How to Analyze and Interpret Your Data
Use funnel analysis to identify where users drop off in their journey - like high abandonment rates during onboarding, which might signal usability issues. Pair this with cohort analysis to see if users are returning consistently week after week, a critical metric for assessing product-market fit.
"Without data on how the user is moving through your product, you won't grasp where they're unlocking the most value. Without those insights, your team and product devolve into conjecture and building for the vocal minority." – Sam Richard, Director of Growth, OpenView
Tools like LaunchSignal's dashboard make this process easier by consolidating high-intent actions - such as email signups or completed questionnaires - into one view. This unified approach helps you quickly spot trends and evaluate your product's performance.
Conclusion and Next Steps
Key Takeaways
Analytics transforms product validation from guesswork into a systematic approach. The most successful startups zero in on behavioral metrics - like retention and conversion rates - rather than getting distracted by vanity stats such as pageviews. They define a "North Star" metric that ties customer value directly to business outcomes, while tracking how smaller user actions contribute to achieving that overarching goal.
"Don't be data-driven - be data-informed. Data can tell you what is happening, while intuition tells you why it's happening." - Lenny Rachitsky, Advisor & Former Lead PM, Airbnb
Understanding your product's "value moment" is another key to success. This is the point where users truly experience the value your product offers. For example, Drew Ashlock, Lead Product Manager at DocuSign, discovered that 82% of agreements were completed in under 24 hours - a significant improvement, reducing turnaround times by 80% compared to paper processes. This insight allowed the team to prioritize features that made document processing even faster.
It's also crucial to focus on metrics that directly influence your business goals. Tools like cohort analysis can help you identify which user behaviors drive long-term retention. In fact, 78% of customers report that product analytics tools enable them to make quicker decisions.
Now, it's time to put these insights into practice by testing your ideas with LaunchSignal.
Getting Started with LaunchSignal
LaunchSignal simplifies idea validation by combining landing page creation, user signal tracking, and analytics into a single platform. Without needing to write a single line of code, you can monitor high-intent actions like email signups, questionnaire submissions, and even simulated checkout completions.
The platform lets you test multiple product ideas simultaneously, helping you discover which concepts resonate most with your audience. With 10,000 monthly page views included and exportable data, you can gather meaningful insights before committing to full-scale development. Get started with the Lifetime plan for just $99, allowing you to validate your first three ideas and build a foundation of actionable user data.
FAQs
What are the most important metrics to track for validating a product idea?
Tracking the right metrics is key to confirming whether your product idea has potential. Start with acquisition metrics - things like website traffic, ad clicks, and sign-up rates. These numbers show how well you’re pulling in potential users. Then, shift your attention to activation metrics, such as completed email sign-ups or filled-out questionnaires, which signal early interest in what you’re offering.
Next up are engagement metrics, like how long users spend on your site or how often they use specific features. These help you understand how people are interacting with your idea. To gauge purchase intent, look at conversion metrics - for example, landing page conversion rates or fake-checkout completions. Finally, don’t forget about retention and satisfaction metrics like repeat visits, Net Promoter Score (NPS), and survey responses. These give you insight into long-term interest and whether users would recommend your product.
If this sounds overwhelming, LaunchSignal makes it easier. Their tools - like pre-built landing pages, email capture forms, and fake checkouts - let you collect these metrics quickly. Plus, they provide real-time analytics in familiar U.S. formats, such as dollar signs for currency and MM/DD/YYYY for dates. This way, you can compare ideas side-by-side and make informed decisions without needing to create a full-fledged product.
How do analytics tools help determine if a product meets market demand?
Analytics tools are a powerful way to gauge whether your product is truly connecting with its intended audience. By analyzing user behavior, these tools provide actionable insights through metrics like activation rates, retention patterns, and repeat usage. These numbers tell a story: Are customers merely testing the waters, or are they weaving your product into their daily routines?
User segmentation adds another layer of clarity. By breaking down users based on demographics or acquisition channels, analytics can reveal which groups are naturally drawn to your product and which are responding to marketing efforts. This detailed view helps pinpoint behaviors that signal long-term success - like users shifting from asking basic support questions to requesting advanced features.
LaunchSignal takes this process a step further. It offers tools to capture real user signals, such as email sign-ups, survey responses, and even simulated purchases. Its analytics dashboard lets you compare multiple product ideas side-by-side, helping you pinpoint which ones are gaining genuine traction. This way, you can make confident, data-backed decisions about where to focus your resources next.
How do I set up an analytics dashboard to validate my product idea?
To design an analytics dashboard that helps validate your product, start by clearly defining your objectives and pinpointing the key metrics you need to monitor. These might include conversion rates, user engagement, or retention rates. Select a platform that aligns with these needs and provides templates to simplify the setup process.
The next step is to implement event tracking. This involves adding code or using tools to capture specific user actions, such as sign-ups or clicks on particular features. Make sure your data is accurate and reliable by filtering out irrelevant traffic and standardizing timestamps. Clean data ensures that your insights are trustworthy and actionable.
Once data collection is in place, focus on creating visualizations that effectively showcase trends, conversions, and user behavior. Use clear and familiar formats, such as MM/DD/YYYY for dates and commas for thousands, to make the information easy to interpret.
To stay on top of important changes, set up alerts for significant shifts in your key metrics. Share the dashboard with your team to provide real-time insights that everyone can access. As your product evolves, regularly review and adjust the dashboard to ensure it continues to support informed, data-driven decisions.
Start validating ideas in minutes not days
Create high-converting landing pages. Test with real users. Get purchase signals. Know what to build next.
Visit LaunchSignal