February 17th, 2026
Ultimate Guide to CTA A/B Testing
Step-by-step guide to planning, running, and analyzing CTA A/B tests to boost conversions, reduce risk, and learn what motivates your users.
Warren Day
CTA A/B testing is a powerful way to improve website conversions by comparing two versions of a Call-to-Action (CTA) to see which performs better. Here's why it matters:
- 90% of visitors notice CTAs, and testing can lead to a 49% boost in conversions.
- Personalized CTAs can perform 202% better than generic ones.
- Testing elements like text, color, size, or placement removes guesswork and focuses on measurable results.
How it works:
- Form a clear hypothesis (e.g., "Changing 'Submit' to 'Get My Free Guide' will increase clicks").
- Test one variable at a time (e.g., button color or text).
- Split traffic randomly, collect enough data, and wait for statistical significance (95% confidence level).
- Use tools like LaunchSignal to set up and monitor tests easily.
Why startups should care:
For startups with tight budgets, A/B testing is a low-risk way to optimize existing traffic, driving more conversions without extra ad spend. Even small tweaks, like adjusting CTA copy or placement, can lead to significant improvements.
Key stats and examples:
- In 2025, a Semrush strategist increased form conversions by 17.5% through a three-week test.
- A marketing agency achieved a 1,500% increase in lead conversions by testing opt-in forms.
CTA testing is not just about clicks - it’s about understanding what motivates your audience and refining your approach over time. Start small, test methodically, and document everything to build on your results.
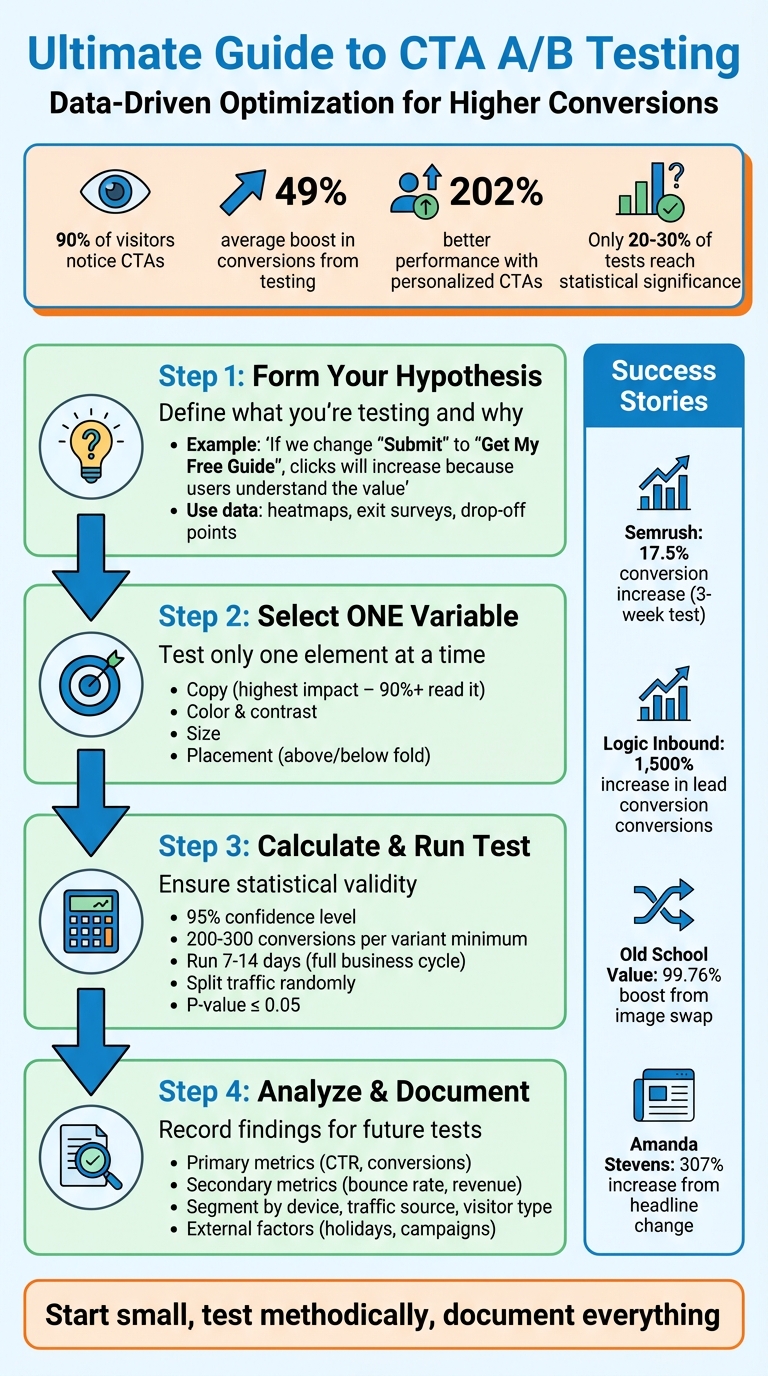
4-Step CTA A/B Testing Process for Higher Conversions
Why CTA A/B Testing Matters for Startups
For startups working with limited budgets, every visitor to your site represents a potential customer. That’s why testing your call-to-action (CTA) buttons can be a game-changer. By running A/B tests, your landing page evolves into a powerful conversion tool that gets smarter with each test. Every interaction becomes a chance to improve and drive results.
Here’s a telling statistic: roughly 60% of companies actively test their landing pages and see measurable improvements. This highlights how vital it is to continually fine-tune your CTAs. When you optimize these key elements, you create a smoother user experience and reduce bounce rates.
Using Data to Increase Conversions
Forget generic advice - testing lets you uncover insights tailored specifically to your audience.
The impact of data-driven testing can be jaw-dropping. Take the example of Jae Jun from Old School Value: in 2021, he tested two product images for his stock-analysis software. Swapping a traditional image for a more modern one boosted conversions by an incredible 99.76%. Similarly, author Amanda Stevens revamped her eBook landing page headline from “New Book Reveals Rescue Remedies for Retailers” to “If you’re a retailer in need of fresh ideas and proven growth strategies, this book is for you!” The result? A staggering 307% increase in conversions.
Even small tweaks can make a difference. In May 2025, Zach Paruch, an SEO Content Strategist at Semrush, conducted a three-week A/B test on a blog pop-up seen by over 200,000 users. By shifting the copy from emphasizing a unique value proposition to leveraging the “fear of missing out,” form conversion rates jumped by 17.5%.
These examples show how data-backed testing strategies help you make informed decisions while driving better results.
Reducing Risk and Improving ROI
A/B testing is a smart, low-risk way to experiment. You can test changes on a small segment of your audience, minimizing the chance of costly mistakes. If a new variation doesn’t perform as expected, you can simply revert to the original - no harm, no foul.
For startups with tight marketing budgets, this approach is invaluable. Instead of pouring money into acquiring new traffic, A/B testing helps you get more out of the visitors you already have. For instance, digital marketing agency Logic Inbound ran split tests on their opt-in forms and saw a mind-blowing 1,500% increase in lead conversions.
Peep Laja of CXL sums it up perfectly:
"Serious gains come from delivering relevance and value in your offer, and the CTA is where that offer is literally put into action".
How to Plan Your CTA A/B Test
Before you dive into tweaking your CTA (Call-to-Action) elements, start with a clear, well-thought-out plan. A successful test begins with a strong hypothesis, focuses on testing one variable at a time, and runs long enough to gather reliable data. Without this structure, you're essentially guessing - and guesses don’t lead to scalable results.
Writing a Clear Hypothesis
Your hypothesis is the foundation of your test. It helps you define why you're changing something, what outcome you expect, and how success will be measured.
A useful format to follow is:
"If we [change specific CTA element], then [metric will improve] because [reason based on data or user behavior]."
For example: "If we change the CTA copy from 'Submit' to 'Get My Free Guide,' then the click-through rate will increase because users will better understand the value they’re receiving."
Ground your hypothesis in real data. Use tools like heatmaps to see where users are clicking, analyze your site’s drop-off points using landing page best practices, and review exit surveys to understand why visitors aren’t converting. Once you’ve gathered insights, decide which specific elements - such as copy, color, size, or placement - are worth testing.
Selecting CTA Elements to Test
Each CTA element can influence conversions differently, so it’s important to choose wisely. Among all elements, copy often has the biggest impact because it communicates your value proposition directly. In fact, over 90% of visitors who read a headline also read the CTA copy, making it a high-priority area for testing.
Other key elements to consider:
- Color and contrast: High-contrast buttons grab attention and often perform better because they stand out from the page.
- Size: Larger buttons can attract more attention but should still fit seamlessly into your design.
- Placement: Positioning matters - testing whether the CTA works better above-the-fold or below-the-fold can help you align it with user intent.
Always test one variable at a time. Testing multiple elements - like color and copy - simultaneously makes it nearly impossible to determine which change led to the results. As Carly Stec, Team Manager for Blog and Academy Acquisition at HubSpot, advises:
"Keep it simple so success is easier to trace".
This principle was put into practice by Paulius Zajanckauskas, Web Growth Lead at Omnisend. In a 2025 experiment, he tested replacing a static hero image with a product video on a landing page. The test, which ran for two weeks and involved 27,000 users per variant, showed that the video version increased product sign-ups by 21%.
Calculating Sample Size and Test Length
Once you’ve decided which element to test, it’s time to calculate the sample size and test duration. Without enough data, your results won’t be reliable. Aim for statistical significance - typically at a 95% confidence level.
Start by using a sample size calculator. Input your current conversion rate and the minimum improvement you want to detect. For example, if your conversion rate is 2% and you want to identify at least a 0.5% improvement, you’ll likely need thousands of visitors per variant.
The length of your test is equally important. Most tests should run for at least one to two weeks - or better yet, a full business cycle - to account for daily and weekly behavioral patterns. Avoid stopping the test early, even if one variant seems to be winning. Only 20–30% of A/B tests result in a statistically significant winner. Define your primary metric, such as click-through rate, before starting, but also monitor secondary metrics like bounce rate or revenue. After all, a higher click rate means little if those clicks don’t lead to conversions.
Running CTA A/B Tests with LaunchSignal
Once you've nailed down your hypothesis, it's time to put it to the test using LaunchSignal's user-friendly platform. With its all-in-one, code-free dashboard, LaunchSignal makes it easy to create test variations, track performance, and analyze user behavior - all without needing a technical background.
Now, let’s dive into how LaunchSignal’s templates simplify the process of setting up your tests.
Setting Up Tests with LaunchSignal Templates
LaunchSignal’s ready-to-use landing page templates eliminate the usual technical hurdles that can slow down testing. You don’t need any coding or design expertise - just pick a template, duplicate it, and tweak the specific CTA element you want to test, whether it’s button text, color, size, or placement.
For example, if you’re comparing "Start My Free Trial" with "Get Started", you’d create two landing pages from the same template, each featuring one of the CTAs. Since these templates are built with conversions in mind, you can focus entirely on the variable you're testing without worrying about layout or functionality issues. This keeps your test straightforward and ensures your results are easy to interpret.
On the Lifetime plan, LaunchSignal allows you to run up to 3 active validation pages simultaneously. This means you can run multiple CTA tests at once or even test different product ideas side by side. Plus, with 10,000 monthly page views included, you’ll have plenty of traffic to achieve statistically reliable results for most early-stage experiments.
Monitoring Performance with LaunchSignal Analytics
LaunchSignal’s real-time analytics dashboard gives you a clear side-by-side comparison of key metrics like page views, clicks, and conversion rates. It also helps you keep an eye on indicators like bounce rates and average order values, so you can ensure your tests are driving meaningful results. This instant feedback lets you make informed decisions based on actual user behavior rather than guesswork.
For instance, imagine your new CTA boosts clicks by 15%, but you notice a 10% increase in bounce rate. This could mean your CTA is attracting the wrong audience. With LaunchSignal’s analytics, you can quickly spot these patterns and adjust your strategy to optimize for both immediate conversions and longer-term user engagement.
Collecting User Data with Email Capture and Fake Checkouts
One standout feature of LaunchSignal is its ability to collect real user signals through tools like email capture and fake checkouts. These go beyond surface-level metrics like clicks, offering deeper insights into user intent.
Email capture lets you test different CTA phrases and form designs while building your contact list for future campaigns. For example, you could test whether "Claim My Free Trial" leads to more email sign-ups than "Start Trial." You can also experiment with the complexity of your form - does asking for just an email outperform a form that requests additional details like product interests or use cases? The data you gather here is invaluable for tailoring future campaigns to specific user segments.
Fake checkouts simulate the purchasing process by tracking how many users proceed through checkout steps, even when no payment is required. This feature is especially useful for testing product ideas or gauging price sensitivity. If users click your CTA but drop off during the fake checkout, you’ve uncovered valuable insights about their intent and can refine your approach accordingly.
Both tools integrate seamlessly with LaunchSignal’s analytics, giving you a complete view of your funnel. This means you’re not just measuring which CTA gets more clicks - you’re also identifying which one drives the most qualified leads and genuine purchase interest. With this detailed data, you can build a solid foundation for analyzing and improving your CTA performance in future tests.
How to Analyze Your Test Results
Once you've gathered data through LaunchSignal's dashboard, the next step is to determine whether your results reflect genuine user behavior or just random noise.
Checking for Statistical Significance
Statistical significance helps you figure out if your results are trustworthy or just a fluke. The standard benchmark is a 95% confidence level, meaning there's only a 5% chance your results happened by accident.
The critical metric here is the p-value, which measures uncertainty. A p-value of 0.05 or lower is what you’re aiming for to confirm reliability. Cassie Kozyrkov, Chief Decision Scientist at Google, explains:
"When we do hypothesis testing, we're always asking, does the evidence we collected make our null hypothesis look ridiculous? ... The closer your p-value is to zero, the closer you are to being certain that your results are not a coincidence".
In simpler terms, a p-value close to zero means your findings are likely not due to chance.
Interestingly, research analyzing 28,304 experiments found that only 20% of A/B tests hit the 95% statistical significance mark. That’s why estimating your required sample size before starting a test is so important. Khalid Saleh, CEO of Invesp, emphasizes:
"Any experiment that involves later statistical inference requires a sample size calculation done BEFORE such an experiment starts. A/B testing is no exception".
Resist the temptation to end a test early, even if early results seem promising. To account for natural fluctuations in user behavior - like weekday versus weekend traffic - run your test for at least seven days or a full business cycle. For lower traffic sites, aim for at least 200–300 conversions per variant to ensure accuracy.
To account for natural variance, consider running an A/A test - comparing your control page against itself. If the variance exceeds 2%, your testing environment might be too noisy.
Recording Findings for Future Tests
Every test, whether it succeeds, fails, or shows no difference, offers valuable insights about your audience. The trick is to document these insights so they can guide future optimizations.
Keep a detailed log that includes your hypothesis, tested variants, key metrics, significance levels, and outcomes. But don’t just stop at the numbers. Dig deeper into the "why" behind the results. For instance, if "Start My Free Trial" outperforms "Get Started", ask yourself: Are users drawn to the clarity of what the trial entails? Or does the word "free" lower the perceived risk?
Break down your results by categories like traffic source, device type (mobile vs. desktop), and visitor type (new vs. returning). Sometimes, a CTA performs better for specific segments, like mobile users or first-time visitors, even if it doesn't win across the board.
Anwar Aly, Conversion Specialist at Invesp, reminds us:
"If the loss rate is normal, businesses should learn from lost tests, recognizing that loss is part of A/B testing and can sometimes be more valuable than wins".
Failed tests can reveal what doesn’t click with your audience, offering clues for improving future campaigns.
Don’t forget to monitor micro-conversions - like how many users begin filling out a form or how far they scroll on a page. These behaviors can shed light on how users interact with your content before they even reach your CTA. For example, if a new CTA increases clicks but lowers completed sign-ups, it might signal that the messaging is attracting the wrong audience or setting unrealistic expectations.
Finally, consider external factors that could have influenced your results. Testing during a holiday season or alongside a major marketing campaign can skew user behavior. Documenting these conditions helps you figure out if your results are likely to hold up under normal circumstances.
Next, we’ll dive into common mistakes to avoid during CTA testing.
sbb-itb-9a9c51d
Common CTA A/B Testing Mistakes to Avoid
Even the best-laid plans can go awry if certain testing mistakes creep in. While proper planning and analysis are crucial, overlooking these common pitfalls can throw off your results. By recognizing and avoiding these errors, you can fine-tune your testing methods and get more accurate insights when optimizing your CTA.
Testing Too Many Changes at Once
Making multiple changes to your CTA in one test can muddle your results, leaving you unsure about what actually worked. As Griffin Cox, Co-founder of ezbot.ai, puts it:
"If you change the color and the text and the placement all at once in one variant, you won't know which change drove any difference in conversion".
This proved true for HubSpot when they tested thank-you pages by changing messaging, placement, and visuals all at once. While conversions went up, the team couldn’t identify the specific factor driving the improvement. They had to redo the experiment with separate tests for each variable, ultimately discovering that placement had the biggest impact. On the other hand, the American Bird Conservancy took a simpler approach, testing only the featured image on a popup campaign. This single-element test produced a 3.99% conversion rate and boosted their lead collection by 1,000%.
Running Tests with Too Little Data
Trying to draw conclusions from a small sample is like predicting a sports season’s outcome after just one game - it’s unreliable at best. Without enough data, random chance can overshadow real user behavior. In fact, only 20%-30% of A/B tests result in statistically significant findings, largely because small samples often lead to inconclusive or misleading results.
Beyond sample size, the duration of your test also plays a critical role in ensuring accuracy.
Ending Tests Before Reaching Significance
Cutting a test short as soon as one version seems to be winning - known as early result-checking - is a recipe for unreliable conclusions. Early fluctuations are common and can easily mislead you, significantly increasing the chances of false positives.
Peep Laja, Founder of CXL, highlights this with a real-world example: after two days and about 100 visits per variant, one test variation appeared to be losing by over 89%, with a reported 0% chance of outperforming the control. Yet, when the test continued to the proper sample size over ten days, that same variation ended up winning with 95% confidence. Laja underscores the importance of patience:
"As an optimizer, your job is to figure out the truth. You have to put your ego aside. It's human to get attached to your hypothesis... Truth above all, or it all loses meaning".
To avoid misleading results, aim to run tests for at least one to two full weeks. This allows you to account for natural daily and weekly variations in user behavior.
How to Improve CTAs Over Time
A/B testing isn’t a one-and-done deal - it’s a continuous process where each experiment sets the stage for the next. The key to real progress lies in treating every winning outcome as the beginning of a new cycle, not the end. Carly Stec, Team Manager for Blog and Academy Acquisition at HubSpot, puts it perfectly:
"At HubSpot, we constantly iterate on our tests to make sure we're not settling for the winner. A win is a starting point for further improvement."
This mindset naturally builds on the testing strategies mentioned earlier, ensuring consistent evolution.
Applying Winning CTA Changes
Once your test reaches 95% confidence, roll out the winning variant and make it your new baseline. Research shows that a successful CTA test can result in an average 49% lift in conversions. To keep the process organized, document everything - your hypothesis, the tested variants, audience segments, and outcomes. This record will serve as a valuable guide for your future experiments.
However, don’t stop at surface-level metrics. For example, a CTA that boosts click-through rates might unintentionally hurt other key areas, like lead quality or eventual sales [1,20]. Dig deeper by segmenting your results. A CTA that performs well overall might underdeliver on mobile devices or with returning visitors, opening up new areas for optimization [1,9,20].
Developing New Test Ideas from Past Results
Each test, whether it succeeds or fails, provides insights to fuel your next hypothesis. With only 20% to 30% of A/B tests delivering statistically significant winners, even the so-called "failures" help clarify what doesn’t work. Look back at your successful tests and ask yourself: what made this variant stand out? For instance, if a direct CTA like "Start Free Trial" outperformed "Learn More", you might want to try something even more specific, like "Start Your 14-Day Trial."
To prioritize new ideas, consider using frameworks like ICE (Impact, Confidence, Ease) or PIE (Potential, Importance, Ease) [7,5]. If past experiments revealed that personalized CTAs perform 202% better than generic ones [1,7], your next test could explore personalization based on user behavior or traffic source.
Establishing a Regular Testing Schedule
Consistency is key for long-term success. Develop a testing roadmap that outlines which elements to test and when. Start with high-impact components, such as your primary CTA button or headline, before moving on to smaller details. To ensure reliable results, run each test for at least 7 to 14 days to account for weekly behavior patterns. Avoid testing during holidays or major sales events unless you’re specifically analyzing seasonal messaging.
Maintain a centralized test log that tracks hypotheses, test durations, traffic volumes, results, and key takeaways. This not only builds institutional knowledge but also prevents redundant testing. As the Adobe Communications Team explains:
"A/B testing should be a regular part of your marketing team's CRO strategy. ... It's a matter of rinsing and repeating".
Conclusion
CTA A/B testing takes the guesswork out of optimizing your landing pages by focusing on data-driven decisions. It’s all about measurable, step-by-step improvements that can significantly boost your conversions.
Here’s a stat to consider: winning A/B tests can lead to an average 49% increase in conversions, and personalized CTAs perform a staggering 202% better. As Griffin Cox, Co-founder of ezbot.ai, aptly explains:
"CTA buttons are the linchpin of conversion optimization".
But let’s be clear - CTA optimization isn’t a one-and-done task. Only about 20% to 30% of A/B tests result in a statistically significant winner. To get the most out of your efforts, focus on testing one variable at a time, document your findings, and aim for a 95% confidence level before locking in any changes. Every test, whether it succeeds or not, contributes to a growing pool of knowledge that helps refine your strategy and better understand what motivates your audience.
Once you’ve nailed down what works through testing, the next step is seamless execution. For startups looking to validate product ideas, tools like LaunchSignal can simplify the process. With LaunchSignal, you can easily create variations, gather real user feedback, and compare results - all without requiring complex technical setups. This allows you to test CTAs in the context of actual product validation, not just isolated marketing efforts.
FAQs
Why is statistical significance important in CTA A/B testing?
Statistical significance plays a key role in CTA A/B testing because it confirms that the differences you see between variations aren’t just a fluke. It helps ensure that the results are based on actual user behavior rather than random chance.
When you base your decisions on statistically significant data, you can confidently choose the better-performing CTA. This approach leads to smarter adjustments and better results for your campaigns.
How can startups effectively use CTA A/B testing with limited resources?
Startups can get the most out of CTA A/B testing by zeroing in on small but meaningful experiments that directly impact conversion rates. Focus on testing elements like the wording, color, placement, and design of your CTA, as these tend to have the greatest effect on how users interact with your site.
To keep things manageable, begin with a clear hypothesis and test just one variable at a time. This approach helps you avoid confusion and ensures your resources aren’t stretched too thin. Using tools or templates that simplify setup and analysis can save time and make the process more efficient. Smaller-scale tests with adequate sample sizes are also a great way to gather useful data without draining your budget.
By concentrating on changes that matter most and carefully analyzing the outcomes, startups can fine-tune their CTAs and boost conversions - even when working with limited time and resources.
What mistakes should I avoid when running CTA A/B tests?
To get trustworthy and actionable insights from your CTA A/B tests, it's important to steer clear of some common missteps. One big issue is not starting with a clear hypothesis or defined success metrics. Without these, it becomes nearly impossible to interpret the results or make solid decisions based on the data.
Another frequent mistake is testing too many variables at once. This approach muddies the waters, making it difficult to pinpoint which specific change influenced the results. Instead, focus on testing one element at a time for clearer and more accurate insights. Also, don’t cut your tests short or work with an insufficient sample size. Tests need enough time and a large enough audience to produce statistically meaningful results. Skimping on either can lead to conclusions that are misleading or outright incorrect.
By sidestepping these common errors, you can gather reliable data to fine-tune your CTAs and boost your conversion rates.
Start validating ideas in minutes not days
Create high-converting landing pages. Test with real users. Get purchase signals. Know what to build next.
Visit LaunchSignal